The Rise Of CI/CD In Analytics

What Is The Last Mile Of The Data Journey?
The last mile of the data journey is where analytics truly deliver value, when people consume insights and make decisions that drive business outcomes. At Wiiisdom, we believe this “last mile” is the critical point where trust in analytics must be established and maintained. To achieve governed and reliable analytics at this stage, organizations need to embrace agile methodologies such as Continuous Integration and Continuous Deployment (CI/CD).
As companies shift from traditional IT-led models to empowering business users with self-service analytics, the challenge becomes ensuring that data remains trusted, governed, and actionable. Despite advances in technology, adoption rates for analytics remain low, often due to a lack of trust and governance. So, how can organizations break through these barriers and deliver analytics that users can rely on, at the speed the business demands? In this article, we explore why CI/CD is essential for Analytics Governance, how it enables trusted decision-making, and how Wiiisdom’s approach helps organizations scale analytics quality and adoption.
What are the current challenges in the Analytics Layer?
It’s true that nowadays BI vendors make their platform more and more accessible to people and consume more and more data from more and more sources. And yes, Data Governance exists to help ensure that the data is reliable, but that doesn’t extend to the last mile of the data journey, the Analytics layer. The Analytics layer is, in fact, a layer with a multitude of sub-components, for example, Tableau + Data Sources and Power BI + Semantic Models. As a result, there are even more potential areas that need to be validated. The freedom of everybody being able to connect with everything comes with three main problems:
1. Analytics Trust
The lack of control from IT and subsequently the lack of some sort of methodology will have users question if they can trust the Analytics they’re consuming. If there is no methodology in place to validate and certify the Analytics, how will users be reassured they can trust them?
2. Analytics Adoption
BI adoption rate is unfortunately stuck at 30% because of the lack of education and trust, and the multiple entry points of data in a company. It’s up to each organization to educate employees on the use of Analytics, improve their data literacy, and implement the right technologies to ensure the best user experience.
3. Risks
Many organizations today are data-driven and make business decisions based on their Analytics. If the Analytics are ungoverned and unreliable, and decisions are based on them, the consequences could be disastrous to the company. Robotic Process Automation (RPA) accentuates the risks with actions being automatically processed based on potentially bad data.
To avoid these problems of trust, adoption, and risk, organizations need to implement Analytics Governance at scale, by implementing agile methodologies like CI/CD.
How can I apply CI/CD To Analytics?
What used to be IT-led has now become something where everybody can do everything, but because of this, the problem of trust, adoption, and risk has increased. Analytics teams still need content to be delivered more frequently and faster, and delivered with fewer or no problems. Companies cannot simply stop self-service because of this, but instead work towards creating a balance between the users being free to do their own things and the information being pushed to the customers. That information needs to be governed and released quickly, and for that to be achieved, you need agile methodologies and automation. These will allow you to:
- Enterprise-scale your Analytics
- Reduce operation costs and TCO
- Fasten time-to-market and increase user satisfaction
- Decrease time-to-repair, mitigating your risks
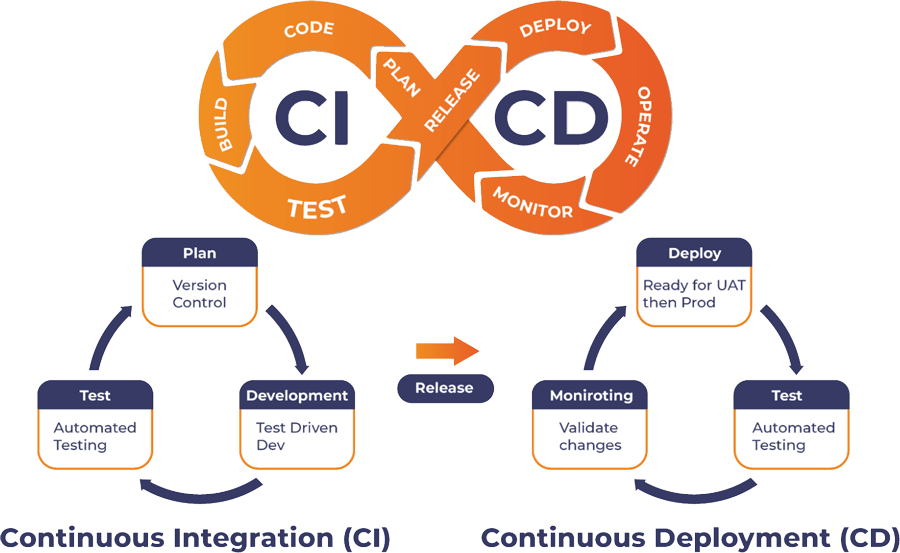
For example, as a way to help businesses with this, Tableau introduced Tableau Blueprint to provide organizations with a framework to become agile and data-driven. In this framework, Tableau states that “an organization’s agility is defined by the repeatable process it has in place”. To do this, the best place to start is to draw inspiration from what has been done elsewhere for other software such as DevOps and DataOps and apply it to BI and Analytics software: AnalyticsOps. This is where Continuous Integration (CI) and continuous deployment (CD) come into play.
CI/CD is a concept of “does it work today, will it continue to work tomorrow?”. It requires you to carry out continuous validation. For example, you develop, you validate everything before releasing, and then repeat this process if necessary. Putting in place test-driven development is even better because you know what the success criteria have to be before releasing – we’ve written an article on how you can do this in Tableau here. Once you have validated and released to production, it’s fundamental to continuously monitor and measure the dashboards. We have released new predictive monitoring capabilities to ensure you keep your platform healthy, cost-efficient, and ready to deliver trusted insights. This will allow developers to find errors before the users do and find them quickly. Automation is a must for CI/CD, and our solutions will allow for this, as highlighted below.
3 Concrete Use Cases For CI/CD Applied To Analytics
To fully understand how CI/CD processes work for your organization to be agile, here are three examples of what can be put in place:
Leveraging Automation At Red Hat For Its CI/CD
Our customer, Red Hat, leverages automation by planning, building, testing, and then releasing to production if everything is okay. It allows them to have faster test case updates and the ability to schedule test cases.

Implementing CI/CD at Red Hat.
Faster Deployment At Unite Us Thanks To CI/CD
Another customer, Unite Us, also leverages CI/CD. They develop, test on the development side, and then once it’s ready to release, a webhook automatically calls Wiiisdom for Tableau. The release is put into a test environment where Wiiisdom for Tableau does a long series of tests. Once everything is as it should be, it goes to production, where Wiiisdom for Tableau will do some further final tests. Both Development to Test and Test to Production are done automatically without any manual intervention, allowing Unite Us to release Tableau dashboards quickly.
Implementing CI/CD In The Semantic Layer
And finally, you can put in place CI/CD every time the semantic layer is updated. Let’s say a dashboard user needs access to some Sales data because something is missing. They would take the existing object, use GIT or the version control software that they use, make the necessary changes (not forgetting to add any test cases), and then make sure everything is working and nothing is breaking. However, the problem is that users cannot do this manually every time a change needs to be made in the Dev environment. Then, once everything is ready on the development side, it’s time to push it to production. Again, checks need to be run in production to make sure everything is working. The great thing about using Wiiisdom for Tableau is that the checks you created in the CI can be reused in exactly the same way in the CD, allowing you to have that repeatable process in place.
Ready To Be Agile?
Successful Analytics requires agile methodologies such as CI/CD to allow for faster time-to-value and ensure trusted and governed data. By using Analytics Governance solutions, like Wiiisdom, organizations can increase trust, user adoption, and the user experience. If you’re interested in knowing more about how to implement agile methodologies for your Analytics platform, get in contact with us today.